Dataslide
Overview of Dataslide
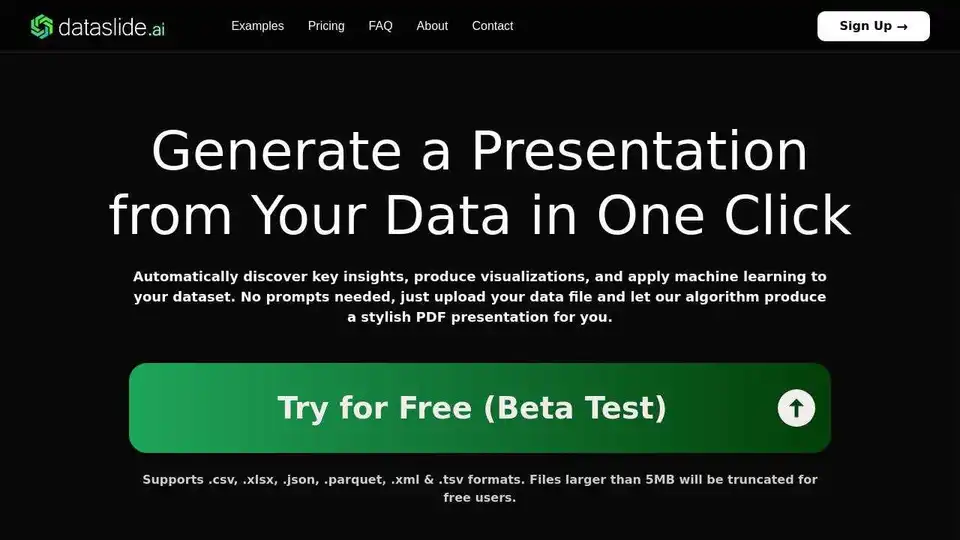
Dataslide: Generate Presentations from Your Data with AI
What is Dataslide?
Dataslide is an AI-powered tool that automatically generates presentation-ready PDFs from your data files. It eliminates the need for manual data analysis and visualization creation, allowing you to quickly uncover key insights and present your findings in a stylish and professional format. Supporting various data formats like .csv, .xlsx, .json, .parquet, .xml, and .tsv, Dataslide streamlines your data analysis workflow.
How does Dataslide work?
Dataslide's algorithm automatically analyzes your uploaded data file to:
- Discover key insights
- Produce visualizations
- Apply machine learning techniques
Without requiring any prompts from the user, Dataslide intelligently identifies patterns, correlations, and trends within your data, and then presents them in a visually appealing and easy-to-understand presentation.
Key Features & Benefits:
- Automated Presentation Generation: Upload your data and let Dataslide create a complete presentation for you.
- Key Insight Discovery: Automatically uncovers important trends and patterns within your data.
- Data Visualization: Generates a variety of charts and graphs to effectively communicate your findings.
- Machine Learning Integration: Applies machine learning algorithms to identify deeper insights and make predictions.
- Multiple Data Format Support: Supports a wide range of data file formats, including .csv, .xlsx, .json, .parquet, .xml, and .tsv.
- Secure Uploads: Dataslide ensures that your data is uploaded and processed securely.
Use Cases:
Dataslide can be used in a variety of scenarios, including:
- Business Intelligence: Quickly analyze sales data, marketing campaign performance, and other business metrics.
- Scientific Research: Visualize experimental results and identify trends in scientific data.
- Education: Create engaging presentations for students and colleagues.
- Data Exploration: Discover insights and patterns in new datasets.
- Manufacturing: Analyze production line data to optimize performance and identify potential issues.
Example Presentations:
Dataslide offers example presentations demonstrating its capabilities:
- Production Line: Analyzes production data from a manufacturing facility.
- Titanic Records: Visualizes data from the Titanic passenger manifest.
- Health: Demonstrates insights from health-related data.
- Temperature Sensor: Analyzes data from a temperature sensor.
- Machine Failures: Identifies patterns related to machine failures.
- Weather & Climate: Visualizes weather and climate data.
Pricing:
Dataslide offers a range of pricing plans to suit different needs:
- Free: For occasional users with small data files (up to 5MB). Includes access to basic features and watermarked PDF output.
- Premium ($20/month): Ideal for students, data enthusiasts, and small businesses. Allows for larger files (up to 50MB), unwatermarked presentations, and PowerPoint/PDF output.
- Professional ($99/month - Coming Soon): Designed for professional analysts and companies with regular datasets. Includes unlimited file size, styled outputs, downloadable ML models, cleaned dataframes, and dedicated support.
FAQ:
- How does Dataslide work? Dataslide automatically analyzes your uploaded data file to discover key insights, produce visualizations, and apply machine learning techniques, presenting it in a stylish PDF.
- Is my data secure? Dataslide ensures secure data uploads and processing.
- How can I get additional analysis in my presentations? The professional plan (Coming Soon) offers downloadable ML models and cleaned dataframes for custom analysis.
About the Developer:
Dataslide was developed by a data scientist with extensive experience working with major companies across diverse industries. Drawing on this experience, the developer created Dataslide to provide a powerful and easy-to-use tool for generating insights and visualizations from any CSV file in seconds.
Get Started Today:
Transform your data into compelling presentations with Dataslide. Sign up for a free account or upgrade to a premium plan to unlock additional features and benefits.
AI Task and Project Management AI Document Summarization and Reading AI Smart Search AI Data Analysis Automated Workflow
Best Alternative Tools to "Dataslide"
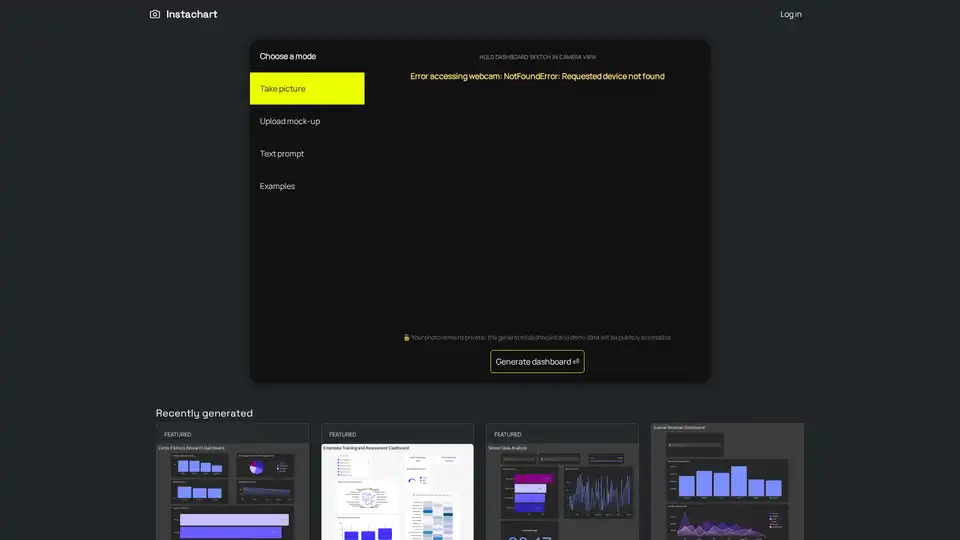
Instachart is an AI-powered tool that converts dashboard sketches, mockups, or screenshots into interactive Luzmo dashboards instantly. Users can upload images or use text prompts to generate functional dashboards for data visualization.
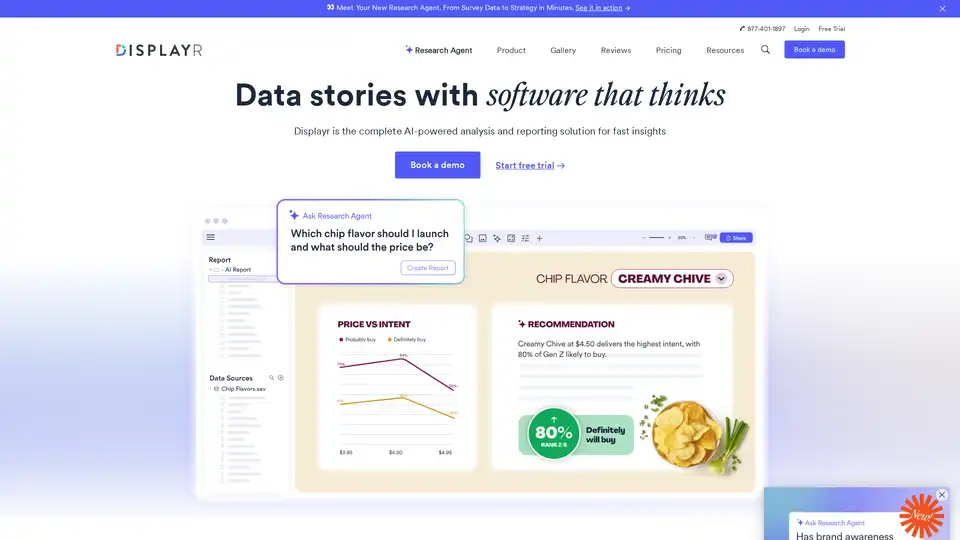
Displayr is an AI-powered analysis and reporting solution transforming data into strategy in minutes. It integrates data, analysis, visualizations, and reports, automating workflows and enhancing insights.

Brewit is an AI-powered data analyst tool that helps businesses make faster data-driven decisions. It connects to your databases, answers data questions by writing SQL, visualizes insights, and creates easy-to-understand reports and dashboards.
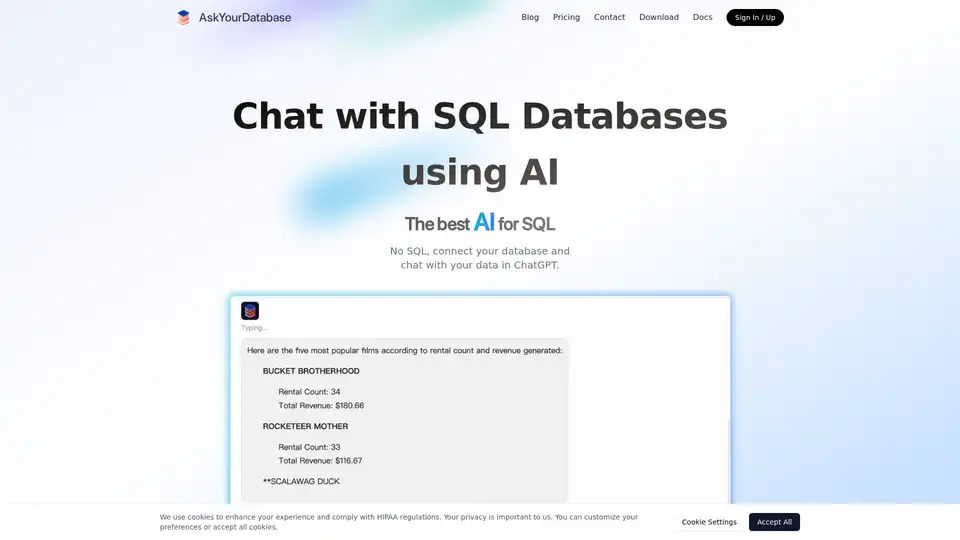
AskYourDatabase is an AI-powered SQL chatbot that allows users to query, visualize, and analyze database data using natural language without SQL knowledge.