Instachart
Overview of Instachart
What is Instachart?
Instachart is an innovative AI-powered tool designed to streamline the process of creating interactive dashboards. By leveraging advanced machine learning algorithms, Instachart can instantly transform dashboard sketches, mockups, or screenshots into fully functional, interactive Luzmo dashboards. This tool is particularly useful for data analysts, business intelligence professionals, and anyone looking to quickly visualize data without the need for extensive technical skills.
Key Features of Instachart
- Instant Transformation: Convert dashboard sketches, mockups, or screenshots into interactive dashboards in seconds.
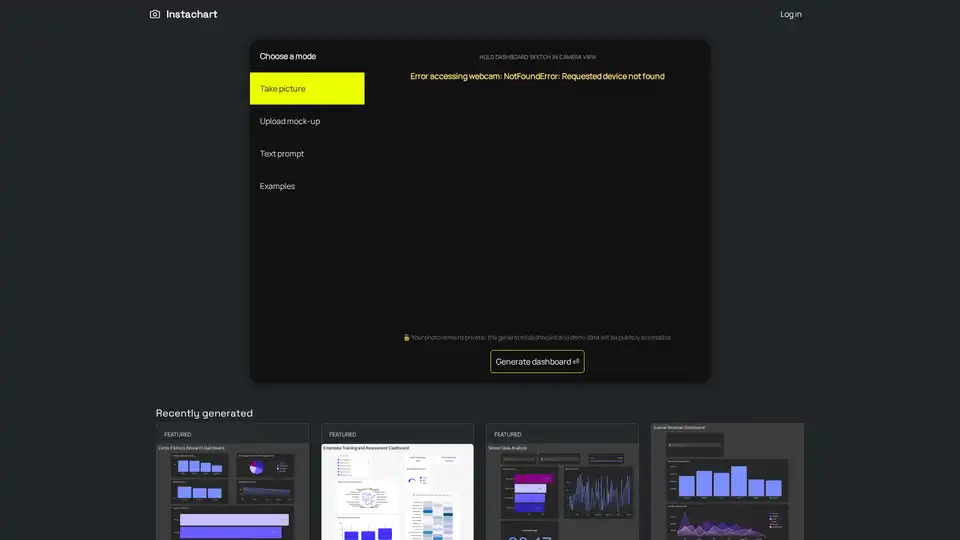
- Multiple Input Methods: Users can upload images, use text prompts, or even capture images directly from their webcam.
- Privacy Assurance: While the generated dashboard and demo data are publicly accessible, the original photos remain private.
- User-Friendly Interface: The tool offers a simple and intuitive interface, making it easy for users to generate dashboards without any technical expertise.
- Versatile Applications: Suitable for a wide range of use cases, including business analytics, research, and data visualization.
How Does Instachart Work?
Instachart uses cutting-edge AI technology to analyze the uploaded images or text prompts. The tool identifies key elements such as charts, graphs, and data points, and then generates an interactive dashboard that closely matches the original design. The process is quick and efficient, allowing users to see their dashboards come to life in a matter of seconds.
How to Use Instachart?
- Choose a Mode: Select from options like taking a picture, uploading a mock-up, or using a text prompt.
- Upload or Capture: Upload an image of your dashboard sketch or capture it directly using your webcam.
- Generate Dashboard: Click the generate button to transform your sketch into an interactive dashboard.
- View and Share: Once generated, you can view and share your dashboard with others.
Why Choose Instachart?
- Speed and Efficiency: Instachart significantly reduces the time and effort required to create interactive dashboards.
- Ease of Use: The tool is designed to be user-friendly, making it accessible to users with varying levels of technical expertise.
- Versatility: Instachart can be used for a wide range of applications, from business analytics to academic research.
- Privacy: Your original photos remain private, ensuring the security of your data.
Who is Instachart For?
Instachart is ideal for:
- Data Analysts: Quickly create interactive dashboards for data visualization and analysis.
- Business Intelligence Professionals: Generate dashboards for business analytics and reporting.
- Researchers: Visualize research data in an interactive and engaging manner.
- Students and Educators: Use Instachart for academic projects and presentations.
- Small Business Owners: Create dashboards for tracking business metrics and performance.
Best Way to Visualize Data
Instachart offers a revolutionary way to visualize data. By transforming sketches and mockups into interactive dashboards, it allows users to focus on the insights and trends within their data rather than the technical details of dashboard creation. This makes it an invaluable tool for anyone looking to make data-driven decisions quickly and efficiently.
Examples of Instachart Dashboards
Instachart has been used to create a variety of dashboards, including:
- Cystic Fibrosis Research Dashboard: Visualize research data related to cystic fibrosis.
- Employee Training and Assessment Dashboard: Track employee training progress and assessment results.
- Sensor Data Analysis: Analyze data from various sensors in an interactive format.
- Casino Revenue Dashboard: Monitor and analyze casino revenue metrics.
- Top Paid Vendors Analysis: Track and analyze payments to top vendors.
- Recruiter Performance Dashboard: Evaluate the performance of recruiters.
- Admin Dashboard: Manage and monitor administrative tasks and metrics.
- Keyword Network in Newspaper Articles: Visualize the network of keywords in newspaper articles.
- Gender Distribution Dashboard: Analyze and visualize gender distribution data.
FAQ
What types of files can I upload to Instachart?
Instachart supports various image formats, including JPEG, PNG, and GIF. You can also use text prompts to generate dashboards.
Is my data secure with Instachart?
Yes, your original photos remain private. However, the generated dashboard and demo data will be publicly accessible.
Can I use Instachart for commercial purposes?
Yes, Instachart can be used for both personal and commercial purposes. It is particularly useful for business analytics and reporting.
Do I need any technical skills to use Instachart?
No, Instachart is designed to be user-friendly and does not require any technical skills. The interface is intuitive and easy to navigate.
How long does it take to generate a dashboard?
The process is quick and efficient. Once you upload or capture your image, the dashboard is generated in a matter of seconds.
Conclusion
Instachart is a powerful and versatile tool that simplifies the process of creating interactive dashboards. Whether you are a data analyst, business professional, researcher, or student, Instachart offers a quick and efficient way to visualize your data. With its user-friendly interface and advanced AI technology, Instachart is the ultimate solution for anyone looking to make data-driven decisions.
AI Task and Project Management AI Document Summarization and Reading AI Smart Search AI Data Analysis Automated Workflow
Best Alternative Tools to "Instachart"
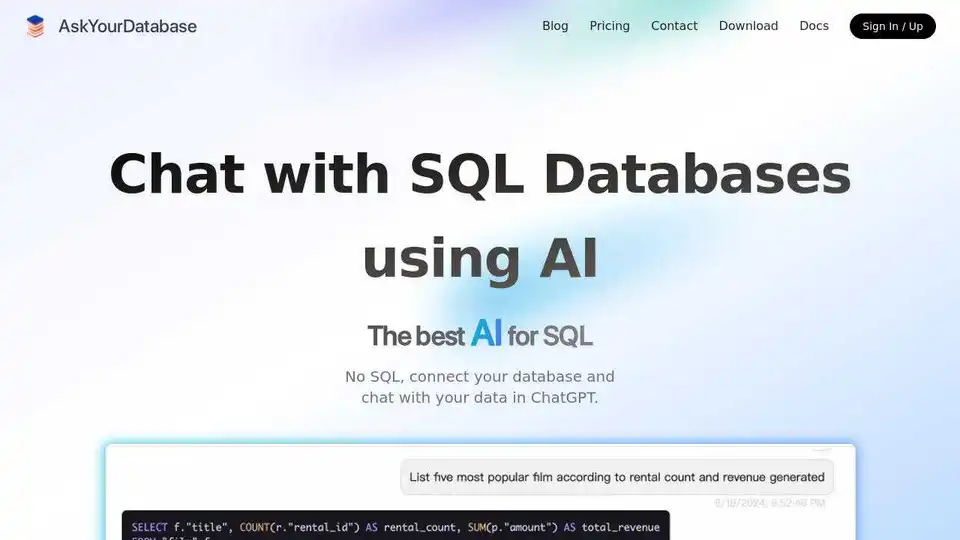
AskYourDatabase is an AI-powered SQL chatbot and AI SQL generator that allows you to interact with your databases using natural language. Query, visualize, and analyze your data effortlessly with AI.
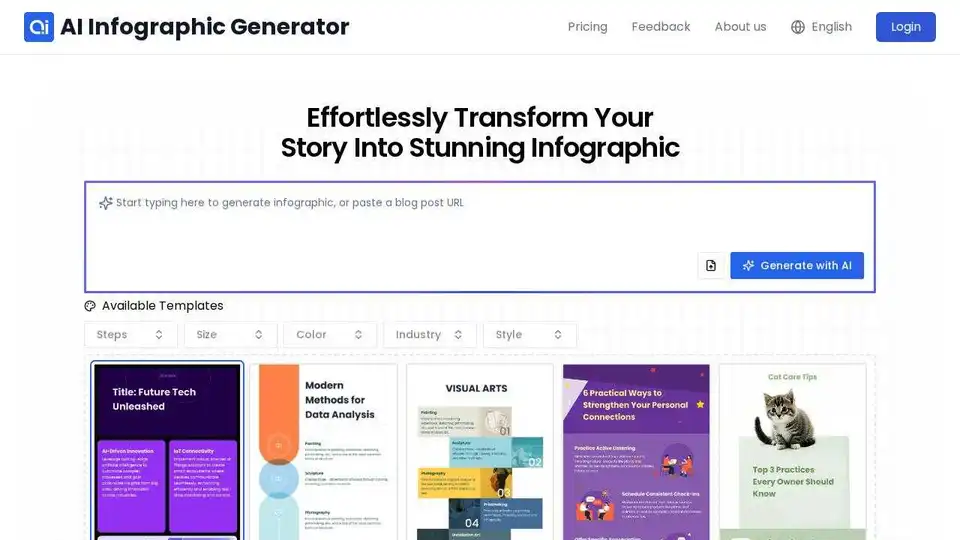
InfographAI is a free AI infographic generator that instantly converts articles, blog posts, PDFs, or text into stunning, customizable visuals. Create eye-catching infographics in seconds!
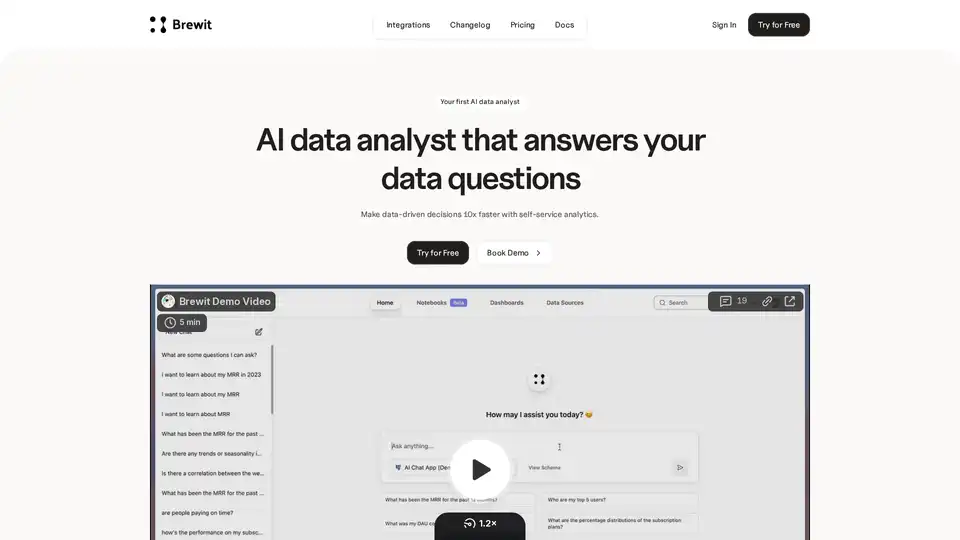
Brewit is an AI-powered data analyst tool that helps businesses make faster data-driven decisions. It connects to your databases, answers data questions by writing SQL, visualizes insights, and creates easy-to-understand reports and dashboards.
AskYourDatabase is an AI-powered SQL chatbot that allows users to query, visualize, and analyze database data using natural language without SQL knowledge.